FIC MATLAB 2017-1: mudanças entre as edições
| (23 revisões intermediárias por 3 usuários não estão sendo mostradas) | |||
| Linha 639: | Linha 639: | ||
* [[FIC MATLAB 2017-1/Aula- | * [[FIC MATLAB 2017-1/Aula-11|Códigos executados em sala]] | ||
<!-- | <!-- | ||
Exercício (livro): Plote a parte imaginária ''versus'' a parte real da função <math>(0,2 + 8i)</math><sup>n</sup> para <math>0 \leq n \leq 20</math>. Escolha uma quantidade suficiente de pontos para obter uma curva suave. Rotule cada eixo e insira um título. Utilize o comando ''axis'' para alterar o espaçamento entro os rótulos dos ''tick-marks''. | Exercício (livro): Plote a parte imaginária ''versus'' a parte real da função <math>(0,2 + 8i)</math><sup>n</sup> para <math>0 \leq n \leq 20</math>. Escolha uma quantidade suficiente de pontos para obter uma curva suave. Rotule cada eixo e insira um título. Utilize o comando ''axis'' para alterar o espaçamento entro os rótulos dos ''tick-marks''. | ||
| Linha 683: | Linha 683: | ||
:* <math>\int x^a dx</math> | :* <math>\int x^a dx</math> | ||
* Interlúdio: comandos ''assume'' e ''assumptions'' | * Interlúdio: comandos ''assume'' e ''assumptions'' | ||
* Comando ''taylor'': Séries de Taylor | * Comando ''taylor'': Séries de Taylor | ||
* comando ''symsum'': Somatórios/séries | * comando ''symsum'': Somatórios / séries | ||
* Outros: ''dsolve'', ''fourier'', ''laplace'' | * Outros: ''dsolve'', ''fourier'', ''laplace'', ''partfrac'' | ||
'''Solução de equações''' | '''Solução de equações''' | ||
* Comando ''solve'' | * Comando ''solve'' | ||
[[FIC MATLAB 2017-1/Aula-13|Códigos executados em sala]] | |||
{{collapse bottom}} | |||
=== Aula 14 === | |||
{{collapse top| bg=lightblue | 19/Abr - Interface gráfica}} | |||
[[Curso Matlab aplicado ao processamento de imagens - Aula 2|Aula]] | |||
{{collapse top| bg=lightblue | Proposta de Interface gráfica}} | |||
<code> | |||
function varargout = Interface(varargin) | |||
% INTERFACE MATLAB code for Interface.fig | |||
% INTERFACE, by itself, creates a new INTERFACE or raises the existing | |||
% singleton*. | |||
% | |||
% H = INTERFACE returns the handle to a new INTERFACE or the handle to | |||
% the existing singleton*. | |||
% | |||
% INTERFACE('CALLBACK',hObject,eventData,handles,...) calls the local | |||
% function named CALLBACK in INTERFACE.M with the given input arguments. | |||
% | |||
% INTERFACE('Property','Value',...) creates a new INTERFACE or raises the | |||
% existing singleton*. Starting from the left, property value pairs are | |||
% applied to the GUI before Interface_OpeningFcn gets called. An | |||
% unrecognized property name or invalid value makes property application | |||
% stop. All inputs are passed to Interface_OpeningFcn via varargin. | |||
% | |||
% *See GUI Options on GUIDE's Tools menu. Choose "GUI allows only one | |||
% instance to run (singleton)". | |||
% | |||
% See also: GUIDE, GUIDATA, GUIHANDLES | |||
% Edit the above text to modify the response to help Interface | |||
% Last Modified by GUIDE v2.5 19-Apr-2017 19:45:52 | |||
% Begin initialization code - DO NOT EDIT | |||
gui_Singleton = 1; | |||
gui_State = struct('gui_Name', mfilename, ... | |||
'gui_Singleton', gui_Singleton, ... | |||
'gui_OpeningFcn', @Interface_OpeningFcn, ... | |||
'gui_OutputFcn', @Interface_OutputFcn, ... | |||
'gui_LayoutFcn', [] , ... | |||
'gui_Callback', []); | |||
if nargin && ischar(varargin{1}) | |||
gui_State.gui_Callback = str2func(varargin{1}); | |||
end | |||
if nargout | |||
[varargout{1:nargout}] = gui_mainfcn(gui_State, varargin{:}); | |||
else | |||
gui_mainfcn(gui_State, varargin{:}); | |||
end | |||
% End initialization code - DO NOT EDIT | |||
% --- Executes just before Interface is made visible. | |||
function Interface_OpeningFcn(hObject, eventdata, handles, varargin) | |||
% This function has no output args, see OutputFcn. | |||
% hObject handle to figure | |||
% eventdata reserved - to be defined in a future version of MATLAB | |||
% handles structure with handles and user data (see GUIDATA) | |||
% varargin command line arguments to Interface (see VARARGIN) | |||
handles.contador = 0; | |||
display(handles.contador) | |||
assignin('base','handles',handles) | |||
% Choose default command line output for Interface | |||
handles.output = hObject; | |||
% Update handles structure | |||
guidata(hObject, handles); | |||
% UIWAIT makes Interface wait for user response (see UIRESUME) | |||
% uiwait(handles.figure1); | |||
% --- Outputs from this function are returned to the command line. | |||
function varargout = Interface_OutputFcn(hObject, eventdata, handles) | |||
% varargout cell array for returning output args (see VARARGOUT); | |||
% hObject handle to figure | |||
% eventdata reserved - to be defined in a future version of MATLAB | |||
% handles structure with handles and user data (see GUIDATA) | |||
% Get default command line output from handles structure | |||
varargout{1} = handles.output; | |||
% --- Executes on button press in btnDesenhar. | |||
function btnDesenhar_Callback(hObject, eventdata, handles) | |||
% hObject handle to btnDesenhar (see GCBO) | |||
% eventdata reserved - to be defined in a future version of MATLAB | |||
% handles structure with handles and user data (see GUIDATA) | |||
%Incrementa o contador | |||
handles.contador = handles.contador + 1; | |||
display(handles.contador) | |||
%handles | |||
%Axis 1 | |||
hold(handles.axes1,'off') | |||
amostras = [0:1:1000]; | |||
if not(isempty(str2num(get(handles.edtFrequencias,'String')))) | |||
Freq = str2num(get(handles.edtFrequencias,'String')) | |||
onda = 2*pi*Freq*0.001*amostras; | |||
plot(handles.axes1,sin(onda)) | |||
grid(handles.axes1,'on') | |||
assignin('base','contador',handles.contador); | |||
assignin('base','hObject',hObject) | |||
% Update handles structure | |||
guidata(hObject, handles); | |||
if (get(handles.rbtCosseno,'Value') == 1) | |||
%Axis 2 | |||
plot(handles.axes2,cos(onda)) | |||
grid(handles.axes2,'on') | |||
elseif (get(handles.rbtTangente,'Value') == 1) | |||
%Axis 2 | |||
plot(handles.axes2,tan(onda)) | |||
grid(handles.axes2,'on') | |||
ylim(handles.axes2,[-2,2]) | |||
else | |||
errordlg('Selecione uma onda de saída!') | |||
end | |||
end | |||
% --- Executes on button press in rbtCosseno. | |||
function rbtCosseno_Callback(hObject, eventdata, handles) | |||
% hObject handle to rbtCosseno (see GCBO) | |||
% eventdata reserved - to be defined in a future version of MATLAB | |||
% handles structure with handles and user data (see GUIDATA) | |||
% Hint: get(hObject,'Value') returns toggle state of rbtCosseno | |||
set(hObject,'Value',1) | |||
set(handles.rbtTangente,'Value',0) | |||
% --- Executes on button press in rbtTangente. | |||
function rbtTangente_Callback(hObject, eventdata, handles) | |||
% hObject handle to rbtTangente (see GCBO) | |||
% eventdata reserved - to be defined in a future version of MATLAB | |||
% handles structure with handles and user data (see GUIDATA) | |||
% Hint: get(hObject,'Value') returns toggle state of rbtTangente | |||
set(hObject,'Value',1) | |||
set(handles.rbtCosseno,'Value',0) | |||
function edtFrequencias_Callback(hObject, eventdata, handles) | |||
% hObject handle to edtFrequencias (see GCBO) | |||
% eventdata reserved - to be defined in a future version of MATLAB | |||
% handles structure with handles and user data (see GUIDATA) | |||
% Hints: get(hObject,'String') returns contents of edtFrequencias as text | |||
% str2double(get(hObject,'String')) returns contents of edtFrequencias as a double | |||
% --- Executes during object creation, after setting all properties. | |||
function edtFrequencias_CreateFcn(hObject, eventdata, handles) | |||
% hObject handle to edtFrequencias (see GCBO) | |||
% eventdata reserved - to be defined in a future version of MATLAB | |||
% handles empty - handles not created until after all CreateFcns called | |||
% Hint: edit controls usually have a white background on Windows. | |||
% See ISPC and COMPUTER. | |||
if ispc && isequal(get(hObject,'BackgroundColor'), get(0,'defaultUicontrolBackgroundColor')) | |||
set(hObject,'BackgroundColor','white'); | |||
end | |||
</syntaxhighlight> | |||
{{collapse bottom}} | |||
{{collapse bottom}} | {{collapse bottom}} | ||
=== Aula 15 === | |||
{{collapse top| bg=lightblue | 24/Abr - Projeto}} | |||
:relógio analógico | |||
:dtmf | |||
:sudoku | |||
:jogo da velha | |||
:contar moedas | |||
:esteganografia | |||
:batalha naval | |||
{{collapse bottom}} | |||
<!-- | <!-- | ||
Exercício (livro - 30 p. 259): Obtenha as plotagens de superfície e de contorno para a função <math>z = x</math><sup>2</sup><math>- 2xy + 4y</math><sup>2</sup>, mostrando o mínimo em <math>x = y = 0 </math>. | Exercício (livro - 30 p. 259): Obtenha as plotagens de superfície e de contorno para a função <math>z = x</math><sup>2</sup><math>- 2xy + 4y</math><sup>2</sup>, mostrando o mínimo em <math>x = y = 0 </math>. | ||
| Linha 716: | Linha 905: | ||
- Comando ''flip'', representa o vetor de trás pra frente; | - Comando ''flip'', representa o vetor de trás pra frente; | ||
Exercício (livro - adaptado - exemplo 6.2-2 p. 278): A tabela a seguir fornece dados de crescimento de uma determinada população de bactérias com o tempo. Ajuste uma equação para esses dados, calcule o coeficiente de ajuste e estime o fluxo no tempo 18 min. Plote a curva escolhida. | Exercício (livro - adaptado - exemplo 6.2-2 p. 278): A tabela a seguir fornece dados de crescimento de uma determinada população de bactérias com o tempo. Ajuste uma equação para esses dados, calcule o coeficiente de ajuste e estime o fluxo no tempo 18 min. Plote a curva escolhida. | ||
| Linha 745: | Linha 929: | ||
{{collapse bottom}} | {{collapse bottom}} | ||
=== Aula 16 === | === Aula 16 === | ||
| Linha 778: | Linha 963: | ||
d) Suponha que os lucros sejam de $200, $500 e $100 para cada produto 1, 2 e 3, respectivamente. Encontre os valores de ''x'', ''y'' e ''z'' que maximizam os lucros. | d) Suponha que os lucros sejam de $200, $500 e $100 para cada produto 1, 2 e 3, respectivamente. Encontre os valores de ''x'', ''y'' e ''z'' que maximizam os lucros. | ||
{{collapse bottom}} | {{collapse bottom}} | ||
=== Aula 17 === | === Aula 17 === | ||
| Linha 837: | Linha 1 023: | ||
{{collapse bottom}} | {{collapse bottom}} | ||
=== Aula 18 === | === Aula 18 === | ||
| Linha 853: | Linha 1 040: | ||
{{collapse bottom}} | {{collapse bottom}} | ||
=== Aula 19 === | === Aula 19 === | ||
| Linha 865: | Linha 1 053: | ||
{{collapse bottom}} | {{collapse bottom}} | ||
=== Aula 20 === | === Aula 20 === | ||
| Linha 873: | Linha 1 062: | ||
{{collapse bottom}} | {{collapse bottom}} | ||
--> | |||
== Questões da turma == | == Questões da turma == | ||
| Linha 887: | Linha 1 076: | ||
alfa = 0.0000971; | alfa = 0.0000971; | ||
II = 10; | |||
N = 200; | N = 200; | ||
L = 0.3; | L = 0.3; | ||
| Linha 899: | Linha 1 088: | ||
% Cálculos | % Cálculos | ||
deltax = L/ | deltax = L/II; | ||
deltat = tempo/N; | deltat = tempo/N; | ||
fon = alfa*deltat/deltax^2; | fon = alfa*deltat/deltax^2; | ||
| Linha 910: | Linha 1 099: | ||
if fon < 0.5 | if fon < 0.5 | ||
T(1,1: | T(1,1:II+1) = T0; | ||
for n = 1:N | for n = 1:N | ||
| Linha 918: | Linha 1 107: | ||
% Outros casos de i | % Outros casos de i | ||
for | for ii = 2:II | ||
T(n+1, | T(n+1,ii) = fon*T(n,ii+1) + (1 - 2*fon)*T(n,ii) + fon*T(n,ii-1); | ||
end | end | ||
% i = | % i = II+1 | ||
T(n+1, | T(n+1,II+1) = fon*(-2*deltax*h*(T(n,II+1) - Tf))/k + (1 - 2*fon)*T(n,II+1) + 2*fon*T(n,II); | ||
end | end | ||
| Linha 937: | Linha 1 126: | ||
</syntaxhighlight> | </syntaxhighlight> | ||
{{collapse bottom}} | {{collapse bottom}} | ||
== Projetos finais == | |||
* [https://github.com/clebercbr/RobotSimulatorMATLAB Projeto 1] | |||
* [[Media:FIC-MATLAB-2017-1-Projeto-2.zip|Projeto 2]] | |||
* [[Media:FIC-MATLAB-2017-1-Projeto-3.zip|Projeto 3]] | |||
* [[Media:FIC-MATLAB-2017-1-Projeto-4.zip|Projeto 4]] | |||
* [[Media:FIC-MATLAB-2017-1-Projeto-5.m|Projeto 5]] | |||
* [[Media:FIC-MATLAB-2017-1-Projeto-6.zip|Projeto 6]] | |||
Edição atual tal como às 10h12min de 13 de junho de 2017
1 Informações Básicas
Professores: Diego da Silva de Medeiros e Roberto Wanderley da Nóbrega
- Início: 06/Mar/2017
- Término: 15/Mai/2017
- Horário: Segundas e quartas, das 19h às 22h
Referência Básica: PALM, William J. Introdução ao MATLAB para engenheiros. Tradução de Tales Argolo Jesus. 3. ed. Porto Alegre: AMGH, 2013. xiv, 562, il. ISBN 9788580552041 Referência Complementar: MORAIS, V.. VIEIRA, C. MATLAB Curso Completo. FCA, 2013. 644. ISBN 9727227058
2 Conteúdos Abordados
2.1 Aula 1
| 06/Mar - Apresentação da disciplina, professores e alunos; Interface do MATLAB e operadores; Utilização básica (comandos help, clear, …); | |||||||||||||||||||||||||||||||||||
|---|---|---|---|---|---|---|---|---|---|---|---|---|---|---|---|---|---|---|---|---|---|---|---|---|---|---|---|---|---|---|---|---|---|---|---|
|
2.2 Aula 2
2.3 Aula 3
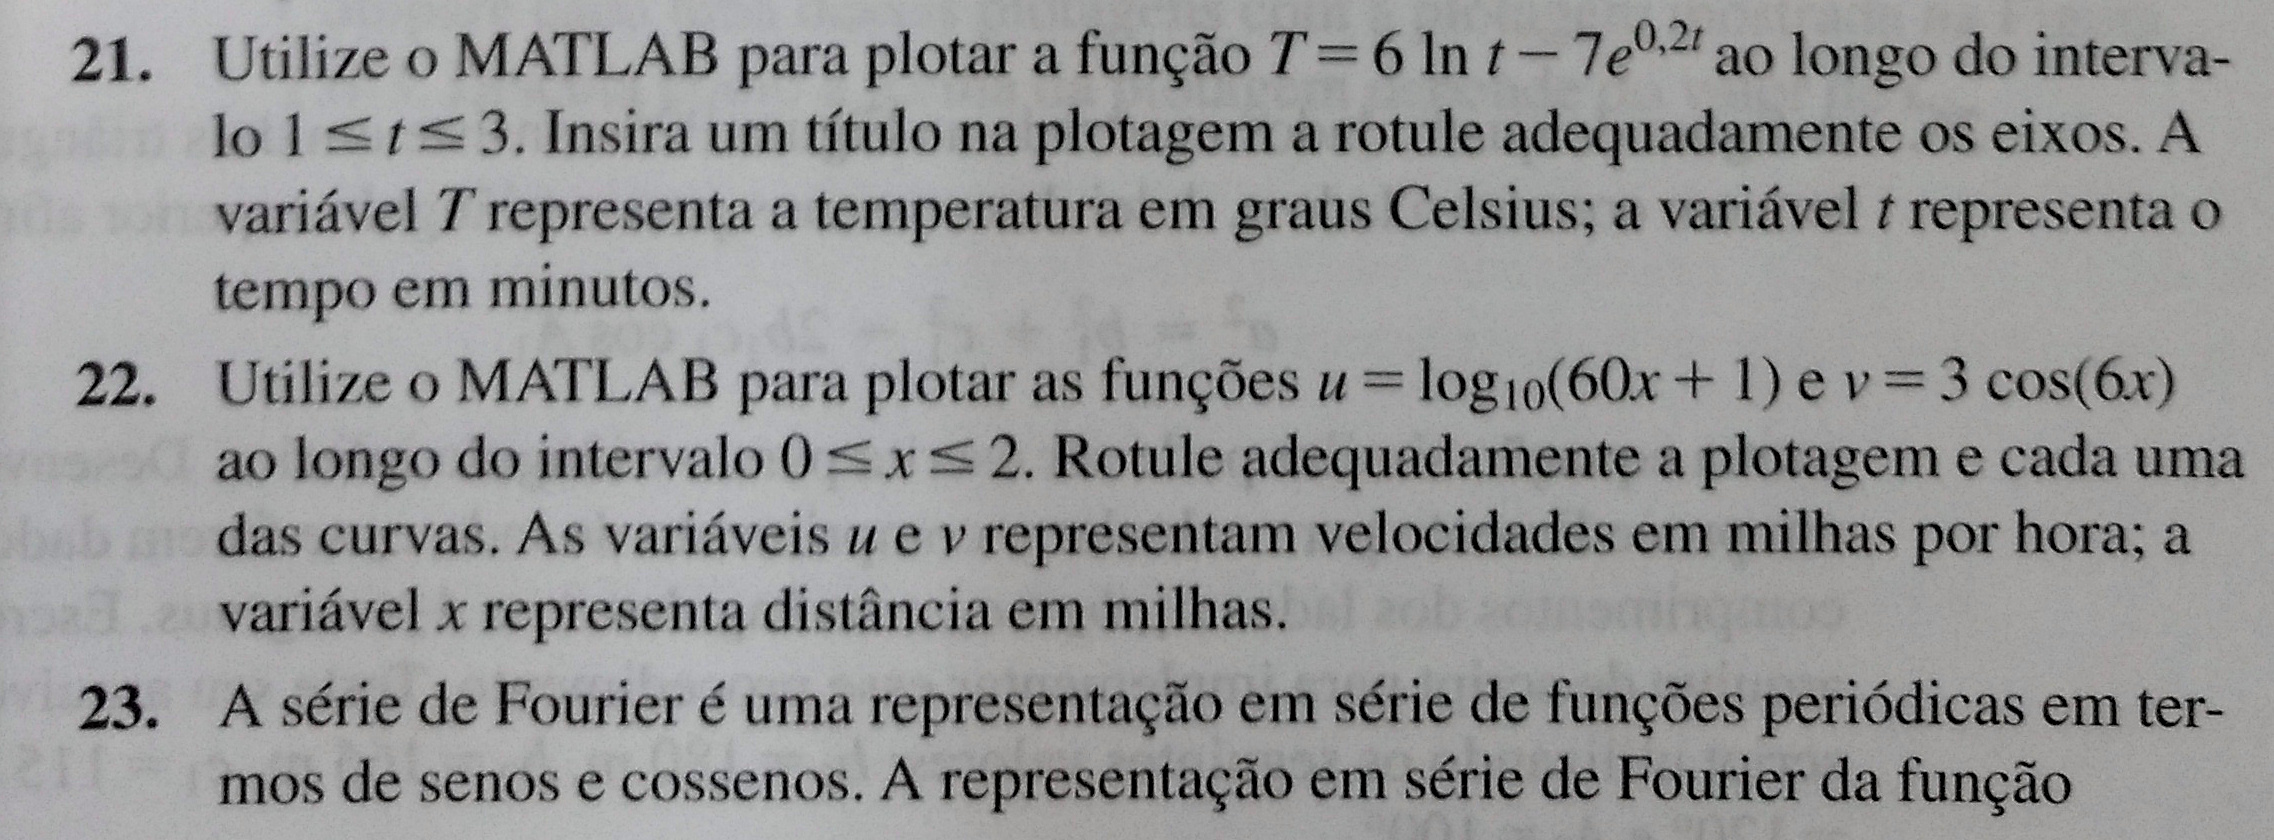
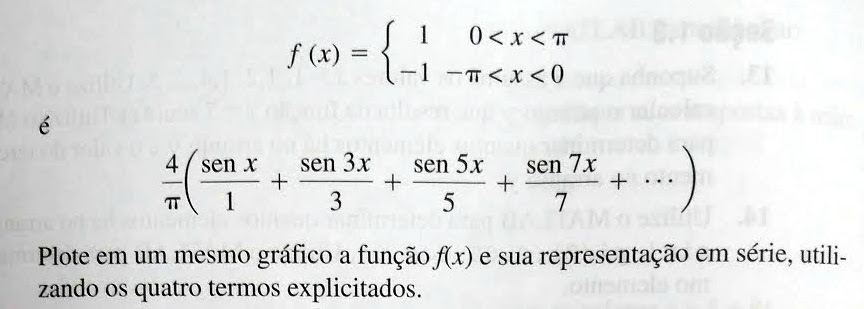
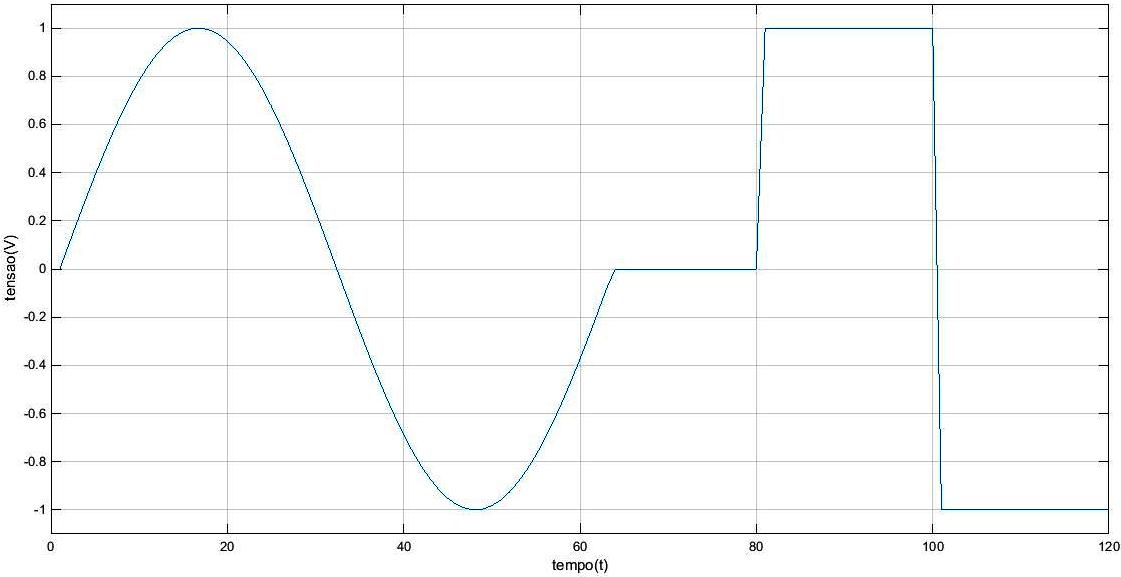
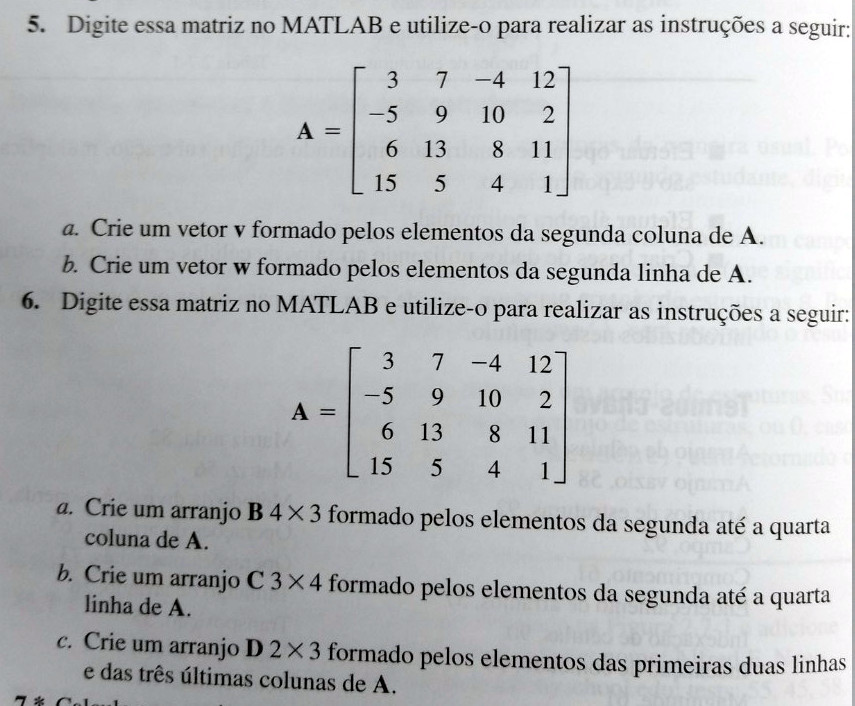
| 13/Mar - Plots; Indexação de vetores e matrizes | ||||||||||||||||||||||||||||||||||||||||||||||||||||||||
|---|---|---|---|---|---|---|---|---|---|---|---|---|---|---|---|---|---|---|---|---|---|---|---|---|---|---|---|---|---|---|---|---|---|---|---|---|---|---|---|---|---|---|---|---|---|---|---|---|---|---|---|---|---|---|---|---|
 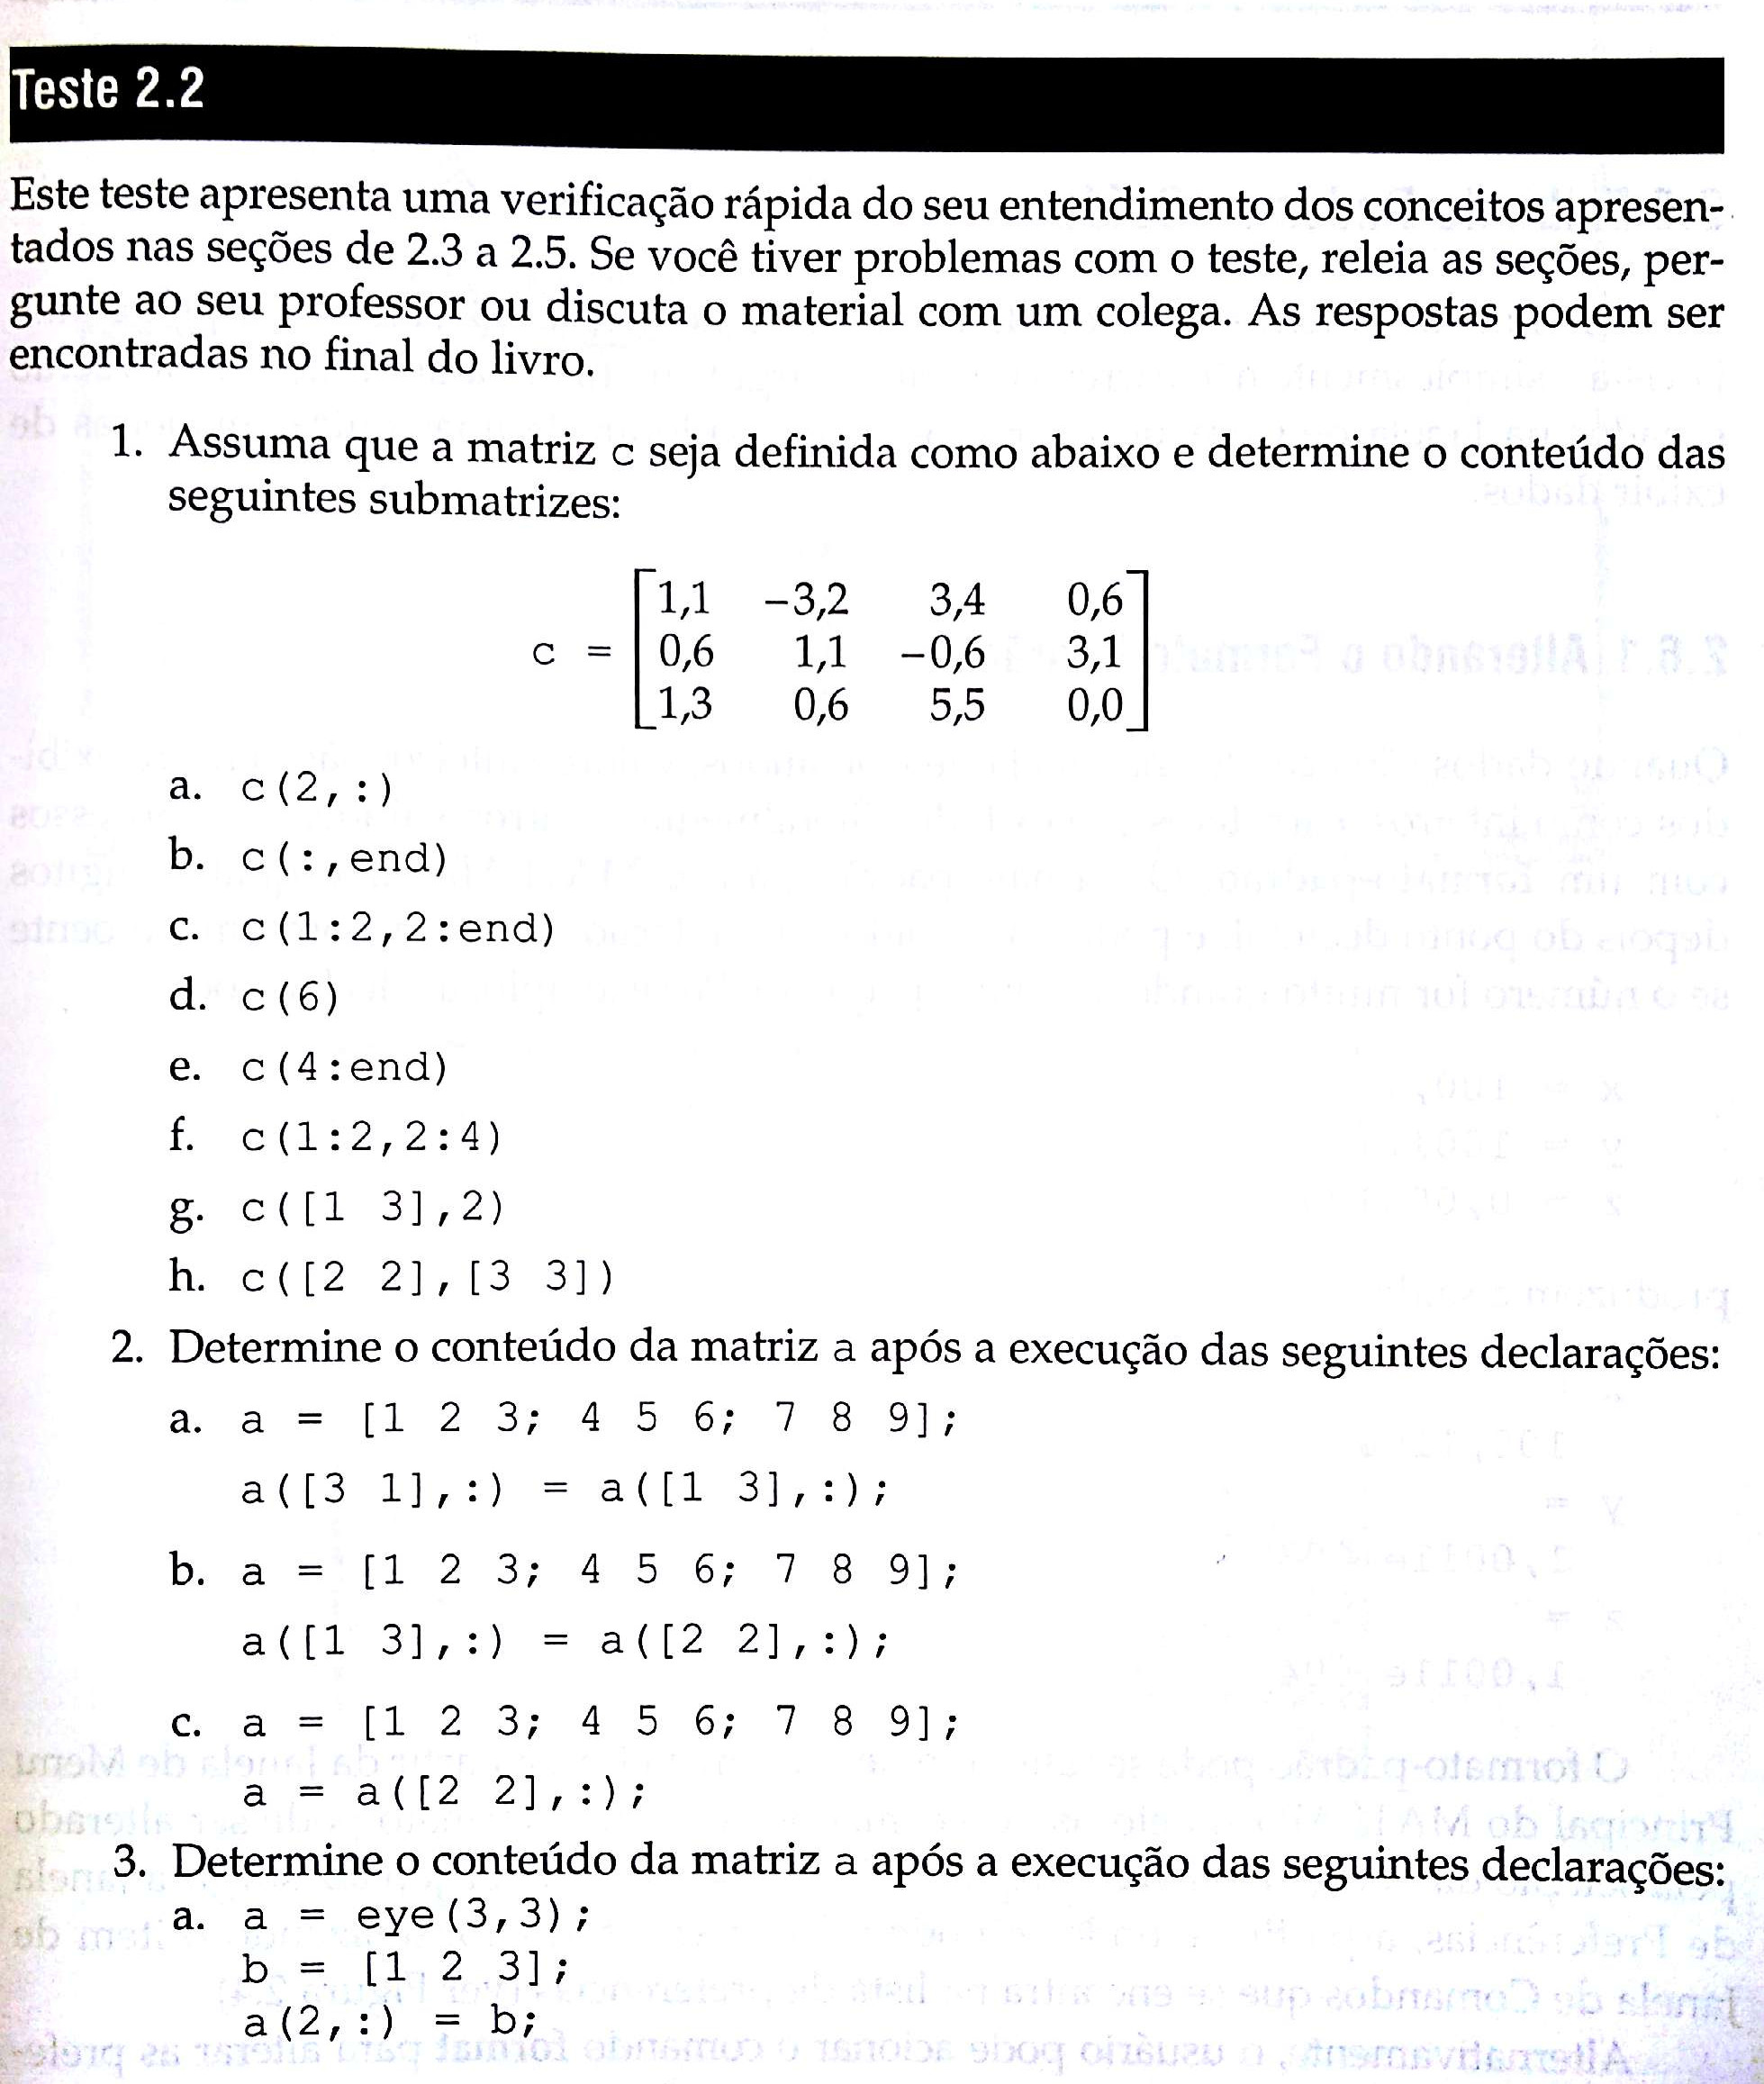 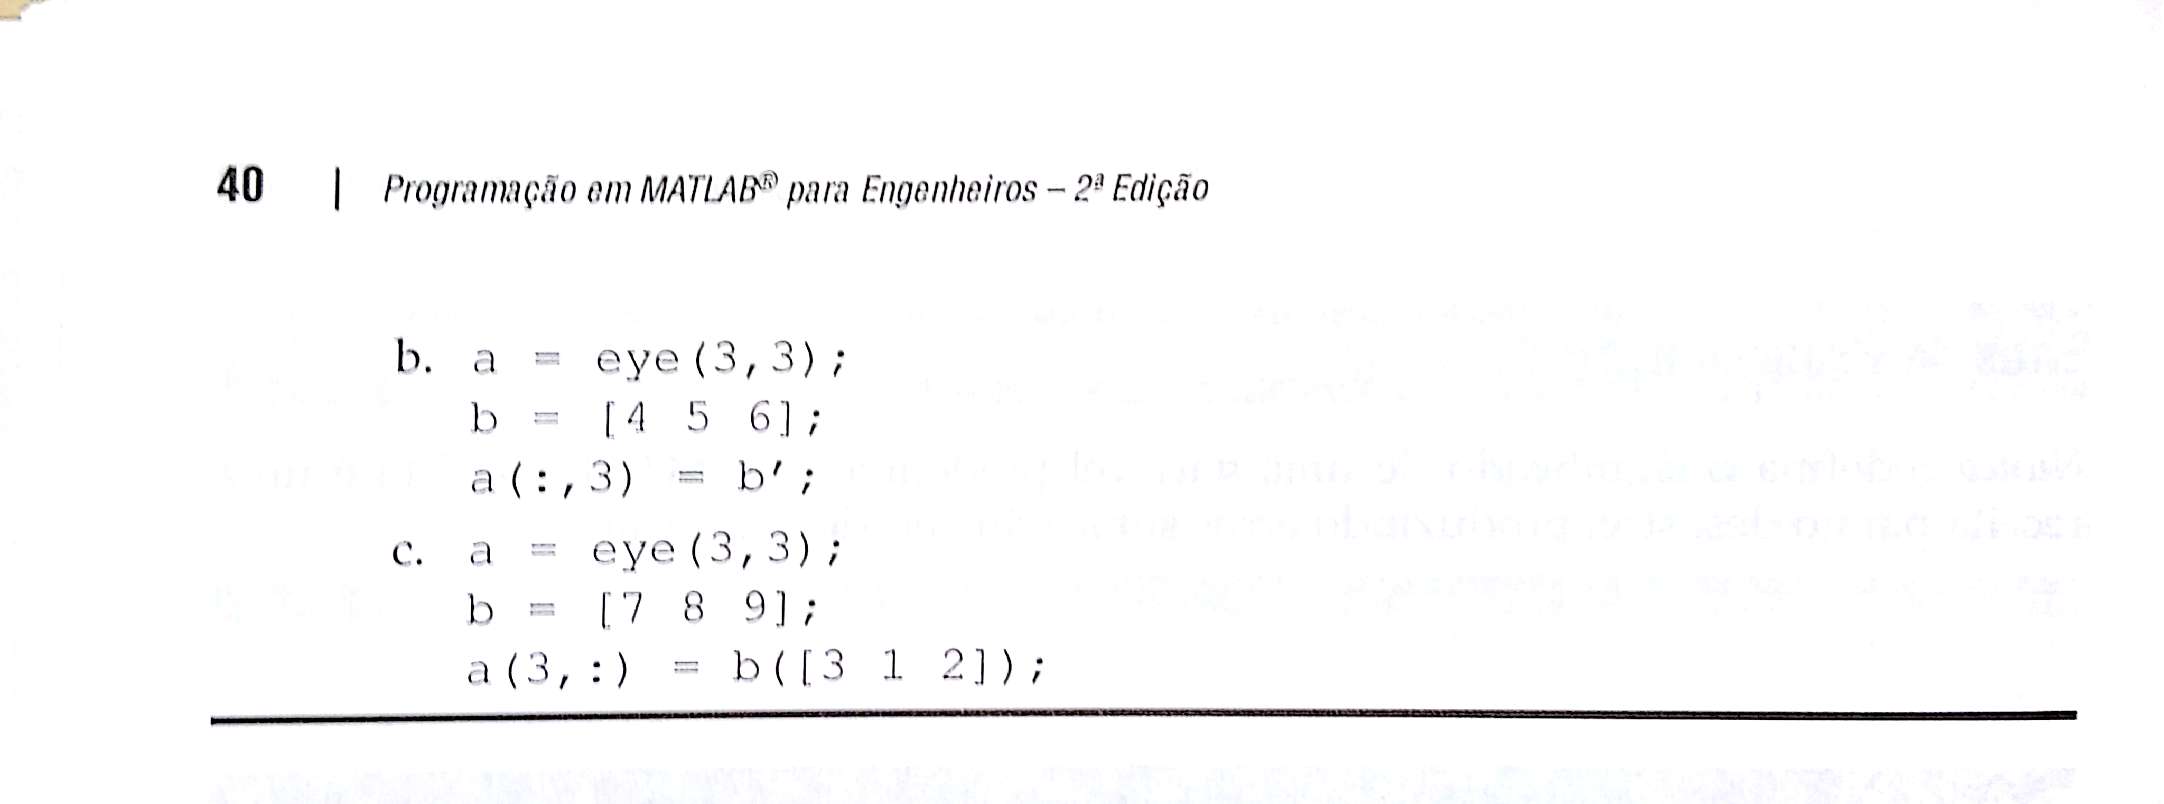 |
2.4 Aula 4
| 15/Mar - Aula de exercícios |
|---|
|
Aula dedicada à execução dos exercícios das aulas anteriores. |
2.5 Aula 5
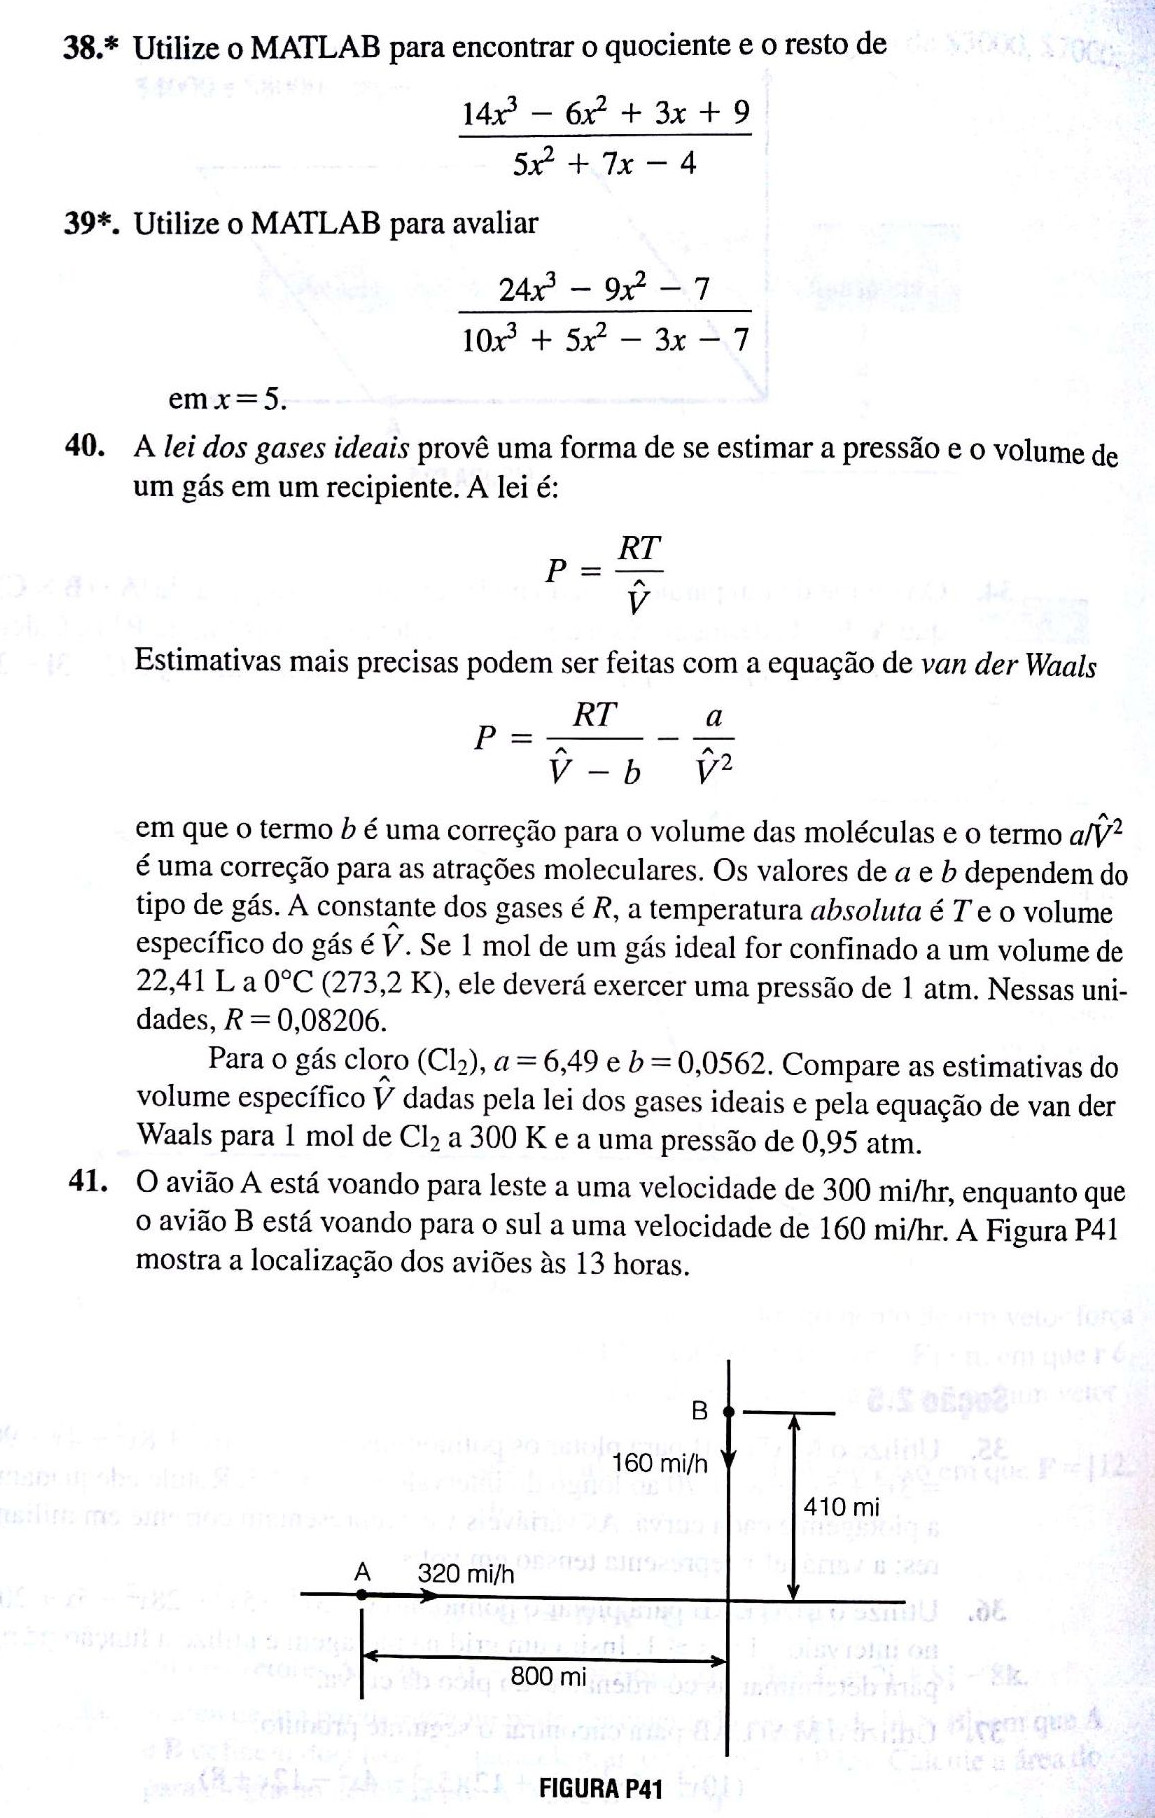
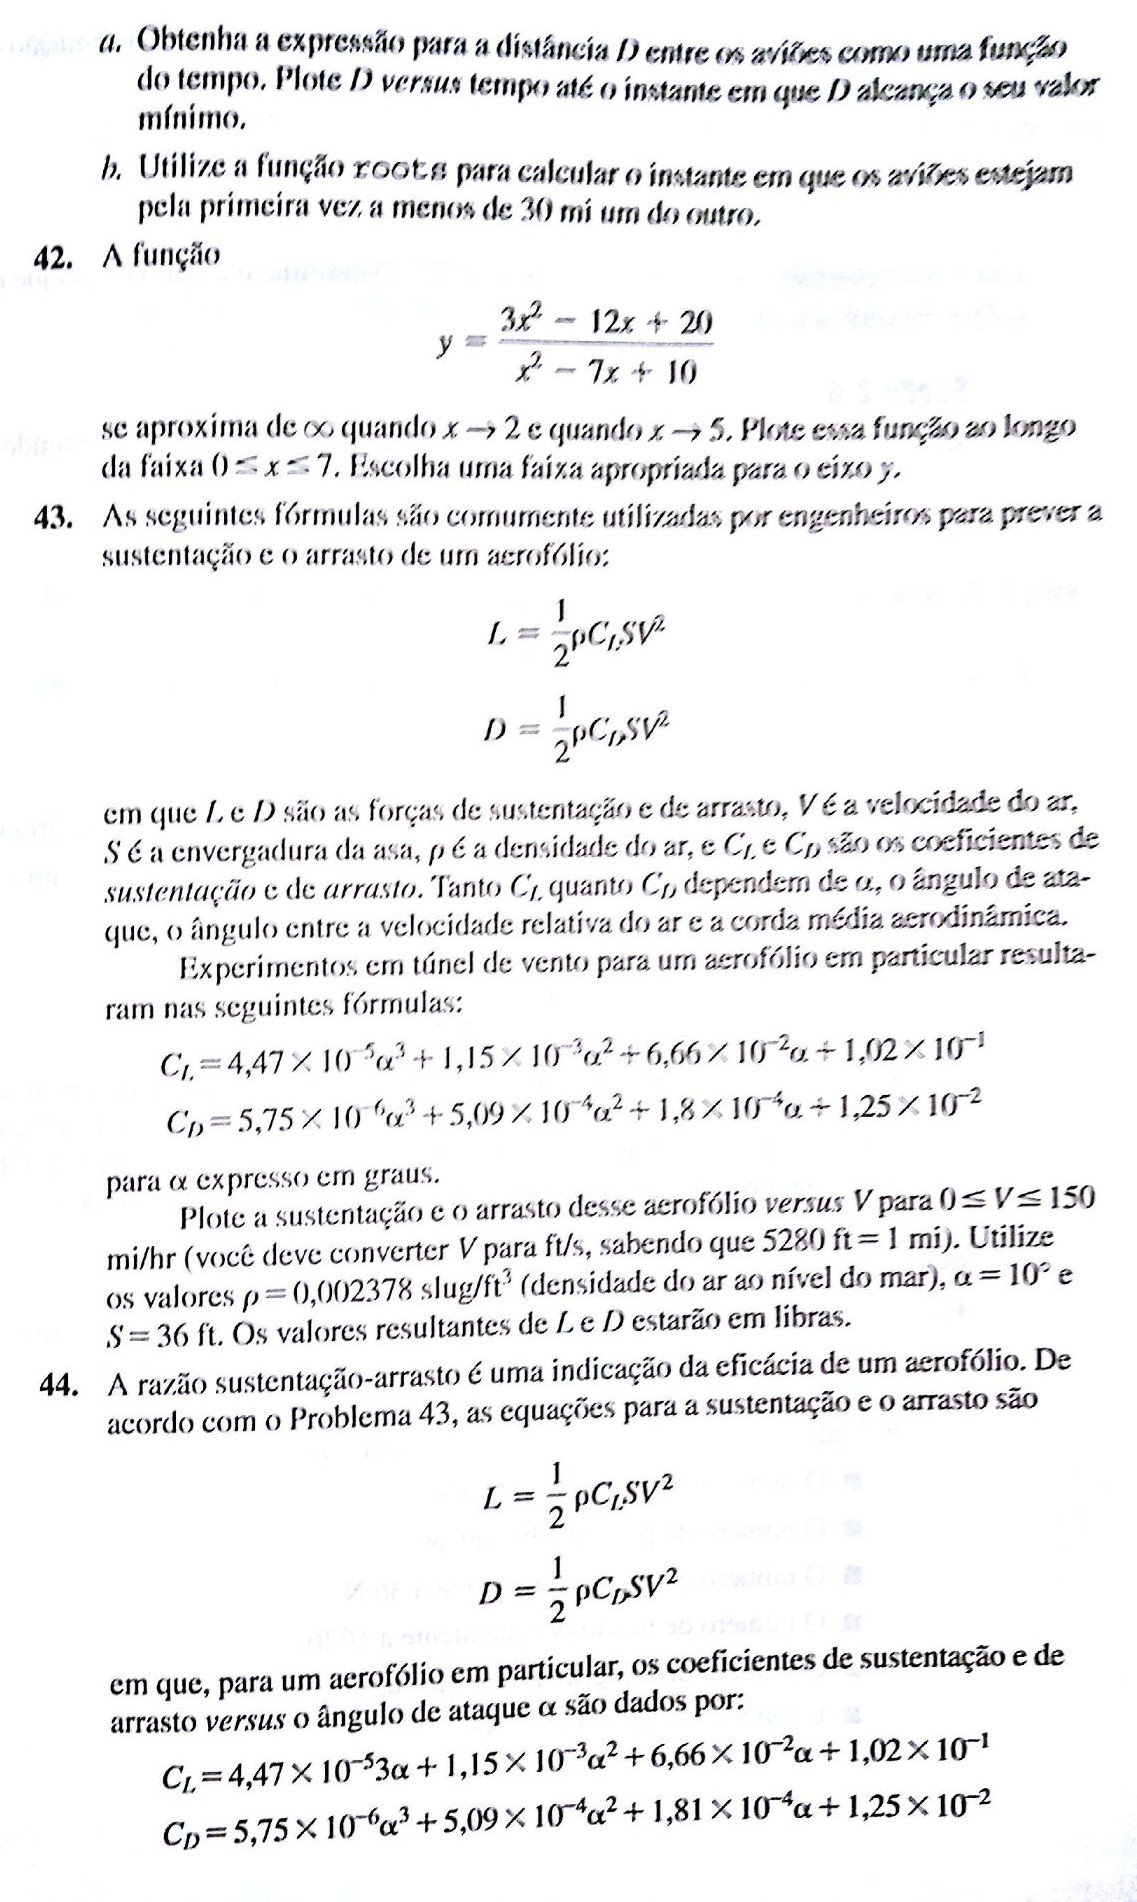
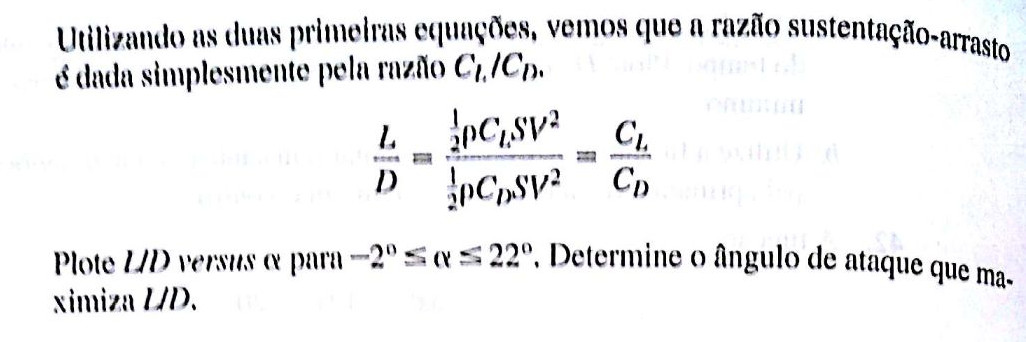
| 20/Mar - Endereçamento lógico; Concatenação de matrizes; Polinômios | ||||||||||||||||||||||||
|---|---|---|---|---|---|---|---|---|---|---|---|---|---|---|---|---|---|---|---|---|---|---|---|---|
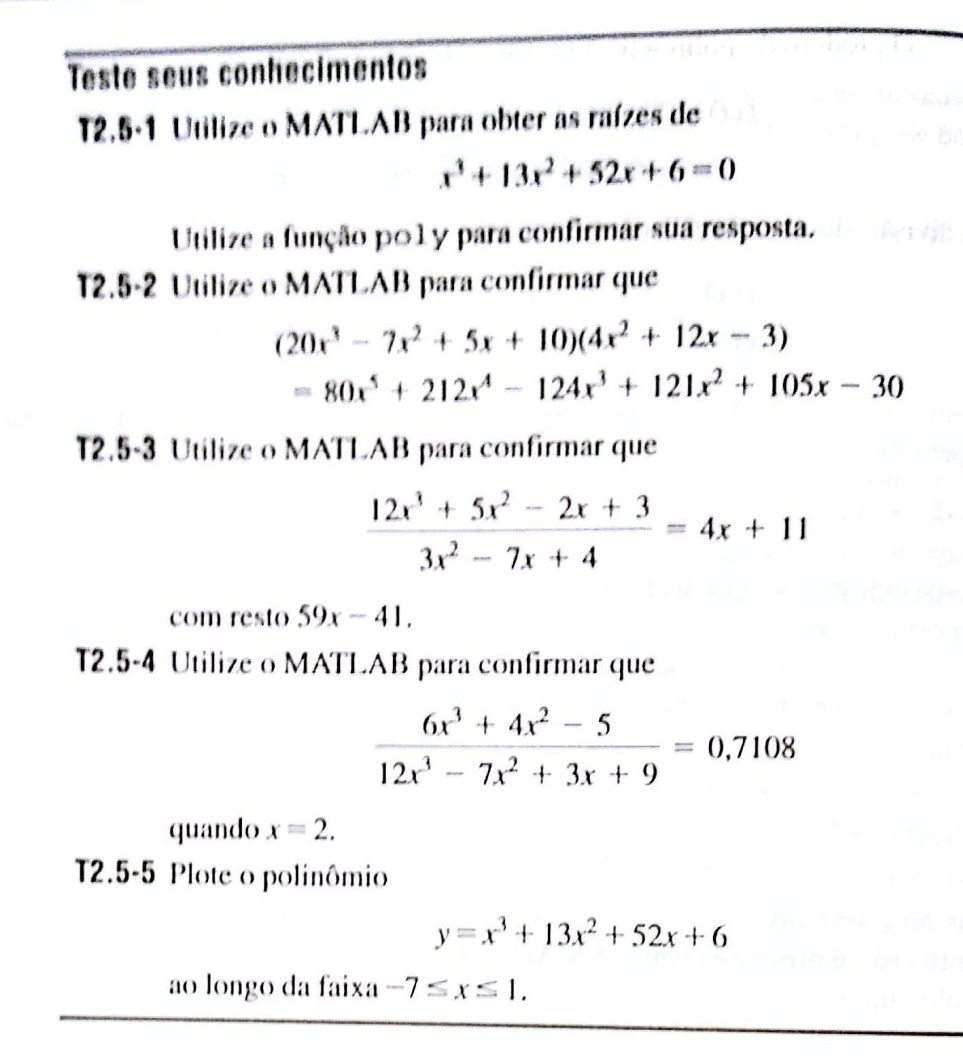 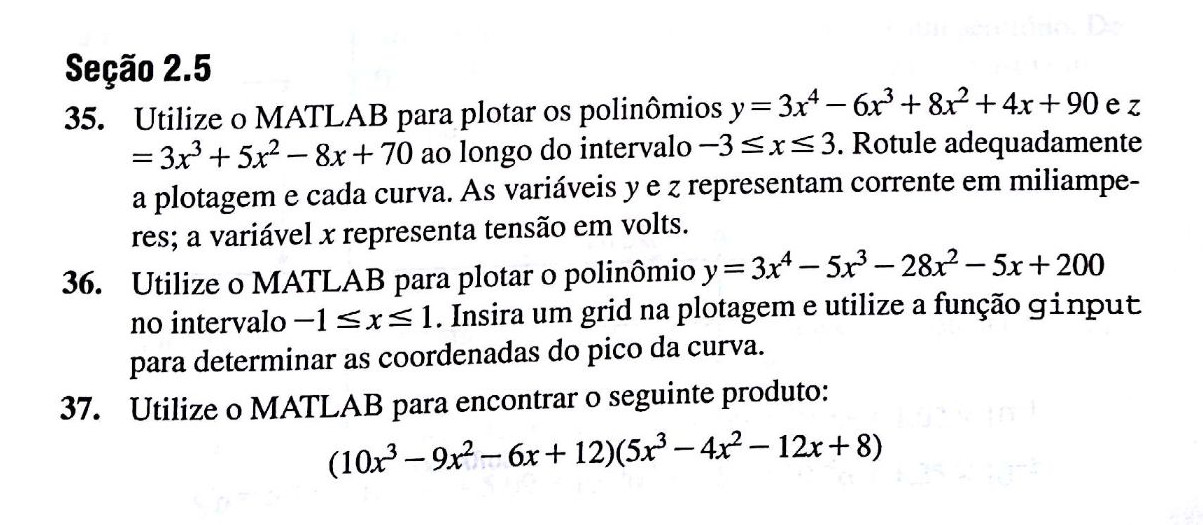    |
2.6 Aula 6
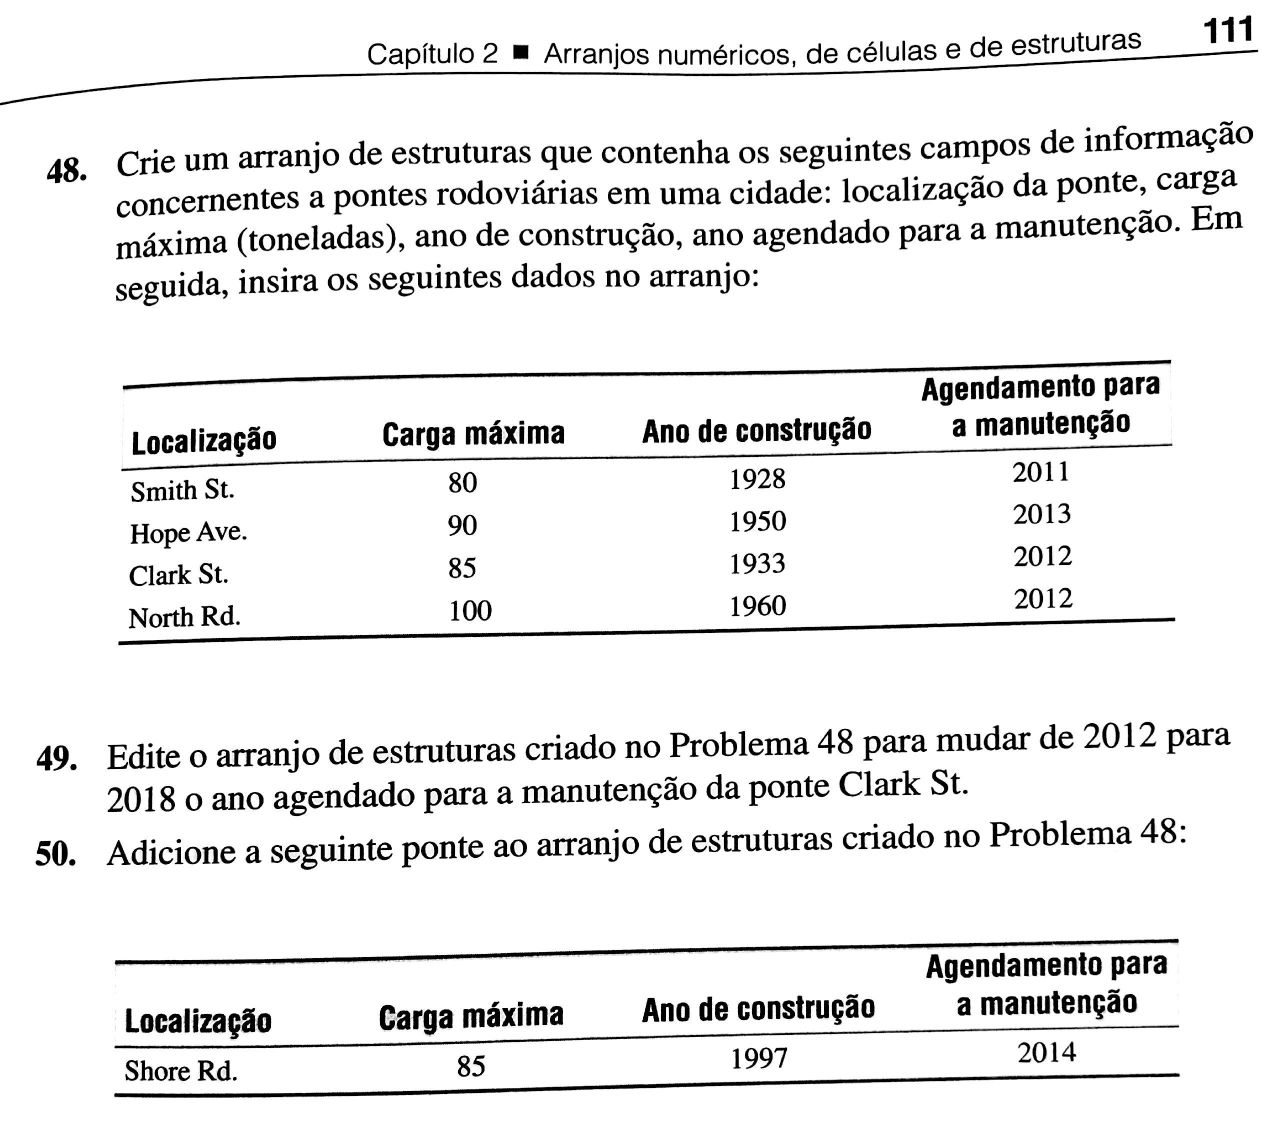
| 22/Mar - Texto; Entrada e saída; Estruturas; Células |
|---|
  |
2.7 Aula 7
| 27/Mar - Operadores; Scripts; Controle de fluxo de dados | ||||||||||||||||||||||||||||||
|---|---|---|---|---|---|---|---|---|---|---|---|---|---|---|---|---|---|---|---|---|---|---|---|---|---|---|---|---|---|---|
|
2.8 Aula 8
| 29/Mar - Switch; Estruturas de repetição |
|---|
|
2.9 Aula 9
| 03/Abr - Funções; Importação de dados |
|---|

Exemplo: usar Celular4g.txt, importar e trabalhar com as funções de matrizes.
Exercício: com o arquivo Add_user.txt (Adições Líquidas de Aparelhos 4G das Operadoras no período), calcular a soma dos anos 2014, 2015 e 2016 (até o momento) por operadora e a soma e a média por período.
|
2.10 Aula 10
| 05/Abr - Gráficos em 2D e 3D | ||||||||||||||||||||||||||||||||||||||||||||||||
|---|---|---|---|---|---|---|---|---|---|---|---|---|---|---|---|---|---|---|---|---|---|---|---|---|---|---|---|---|---|---|---|---|---|---|---|---|---|---|---|---|---|---|---|---|---|---|---|---|
[X,Y] = meshgrid(-20:0.5:20);
R = sqrt(X.^2 + Y.^2) + eps;
Z = sin(R)./R;
mesh(X,Y,Z)
|
2.11 Aula 11
| 10/Abr - Aula de exercícios |
|---|
|
Aula dedicada à execução dos exercícios das aulas anteriores.
|
2.12 Aula 12
| 12/Abr - Processamento de imagens |
|---|
2.13 Aula 13
| 17/Abr - Toolbox simbólico |
|---|
|
Básico
Cálculo
Solução de equações
|
2.14 Aula 14
| 19/Abr - Interface gráfica | ||
|---|---|---|
|
2.15 Aula 15
| 24/Abr - Projeto |
|---|
|
3 Questões da turma
3.1 Exercícios Engenharia de Alimentos
| Método explícito |
|---|
clear all; close all; clc

alfa = 0.0000971;
II = 10;
N = 200;
L = 0.3;
tempo = 200;
a = 20;
k = 237;
h = 85;
Tf = -300;
T0 = 20;

% Cálculos

deltax = L/II;
deltat = tempo/N;
fon = alfa*deltat/deltax^2;

% Algoritmo

% Convergência
fon

if fon < 0.5

    T(1,1:II+1) = T0;

    for n = 1:N

        % i = 1
        T(n+1,1) = 2*fon * T(n,2) + (1 - 2*fon)*T(n,1);

        % Outros casos de i
        for ii = 2:II

            T(n+1,ii) = fon*T(n,ii+1) + (1 - 2*fon)*T(n,ii) + fon*T(n,ii-1);

        end

        % i = II+1
        T(n+1,II+1) = fon*(-2*deltax*h*(T(n,II+1) - Tf))/k + (1 - 2*fon)*T(n,II+1) + 2*fon*T(n,II);

    end
end

% Resultados
figure
surf(T)
view(0,90)
xlabel('x'); ylabel('t')
|
